
FreeBSD comes out of the box with three great tools for monitoring. If you need more info about how these tools work, please read the official documentation. I’ll explain the installation only and creating a simple dashboard.
The installation is very simple. These amazing tools don’t need any external libraries. We’ll install the packages and enable them to start on boot.
pkg install prometheus node_exporter grafana5
sysrc prometheus_enable=YES
sysrc node_exporter_enable=YES
sysrc grafana_enable=YES
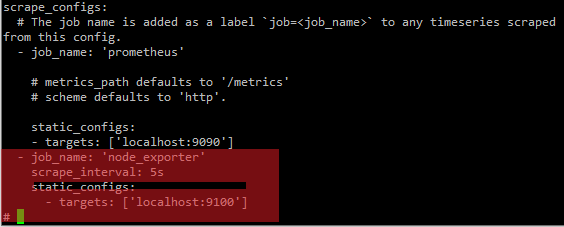
Add these lines at the very end in /usr/local/etc/prometheus.yml. Make sure you have the proper spacing. Check the job_name above. They have to be in line.
- job_name: 'node_exporter'
  scrape_interval: 5s
  static_configs:
    - targets: ['localhost:9100']
Looks like this.
Now start the services.
service prometheus start
service node_exporter start
service grafana start
Go to http://your_ip:9090. This is how it should look like.
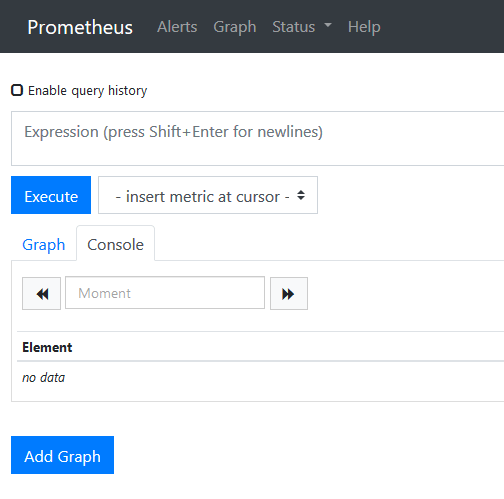
Type prometheus_http_requests_total or node_memory_active_bytes in the Expression field and click on Execute. You should see some output below.
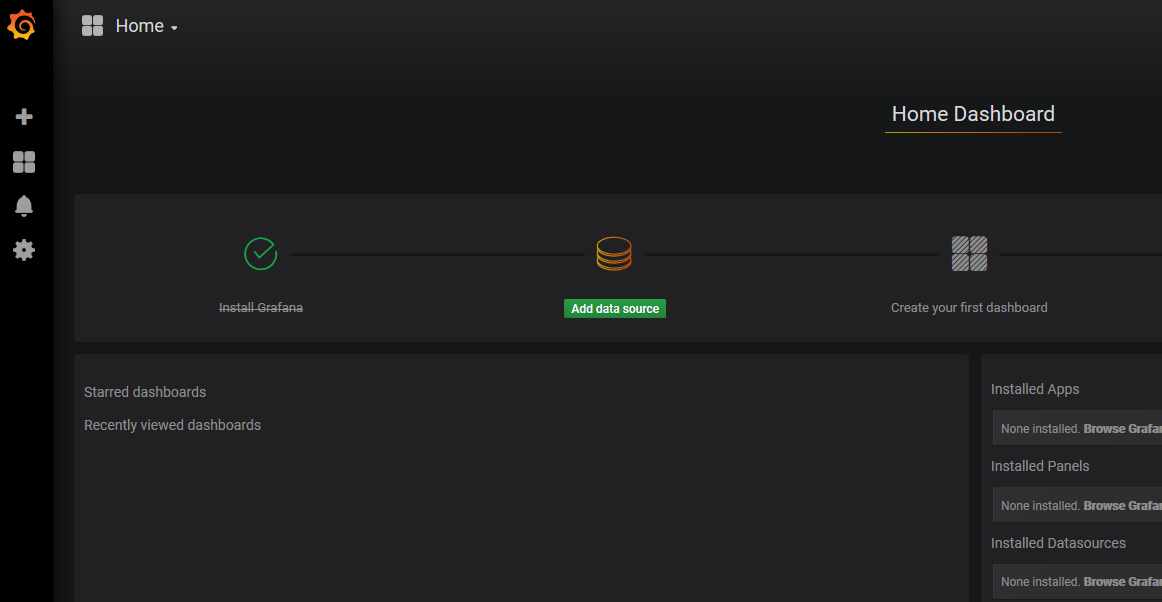
Now go to Grafana at http://your_ip:3000. Log as admin/admin and you’ll be prompted to change your password. From the Home Dashboard click on Add Source, right in the middle.
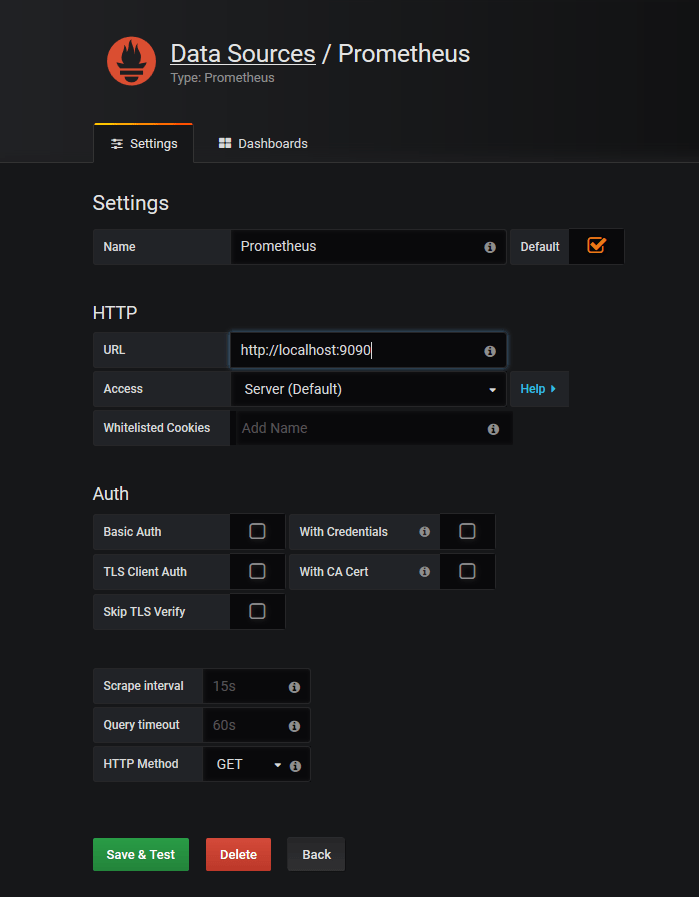
Click on the Prometheus icons from the choice of the others. You’ll be prompted to fill out this form. Just make sure the URL is http://localhost:9090. Click Save & Test and make sure it’s OK.
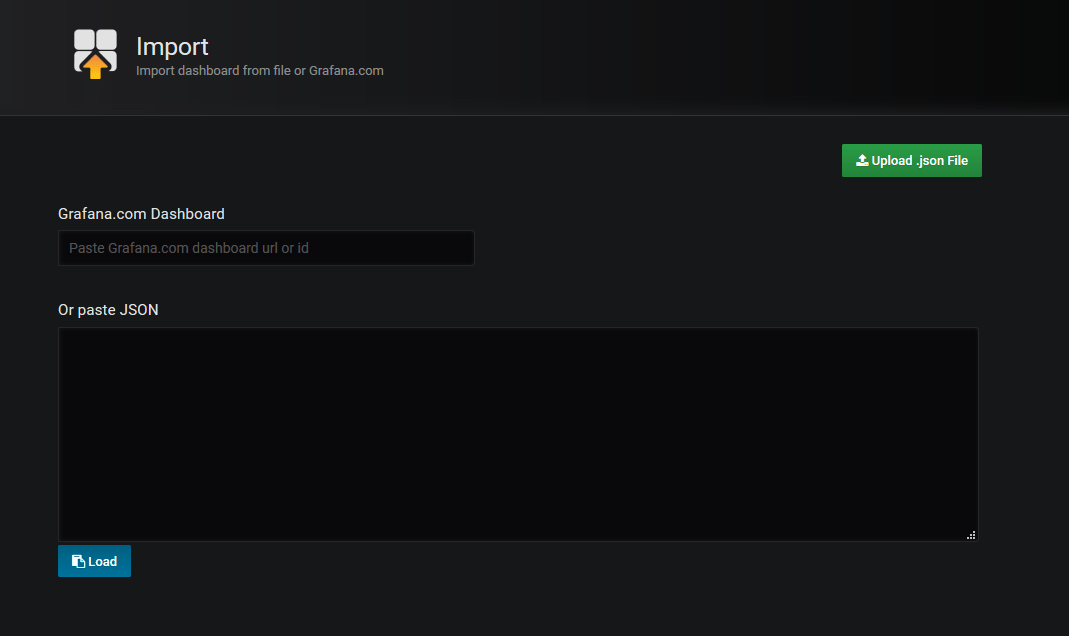
Now, in the upper left corner where the Grafana logo is, click on the Plus (+) sign and choose Import. In another browser tab go to this link and on the right side click on Download JSON. Save it somewhere. Go back to your Grafana dashboard and click on Upload .json file.
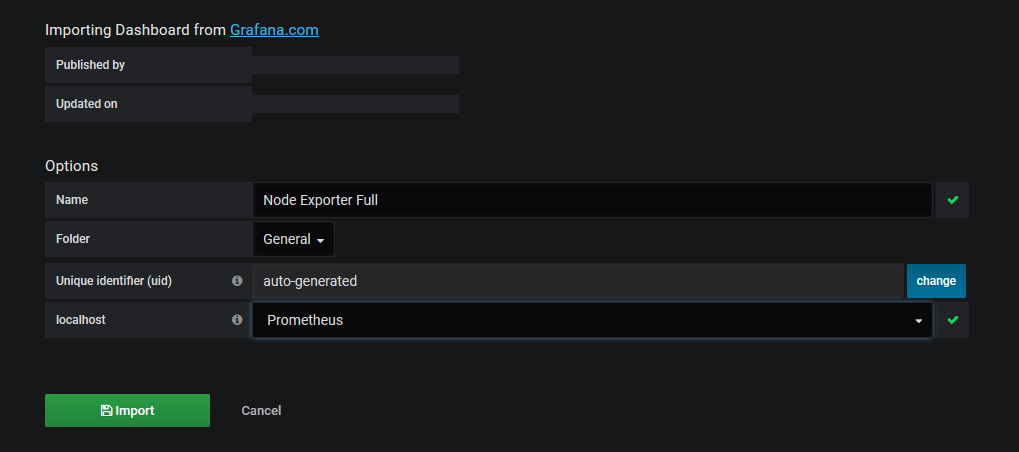
Find the JSON file that you saved in the previous step and upload it. You’ll see this screen. Just make sure to choose Prometheus under localhost parameter and click Import.
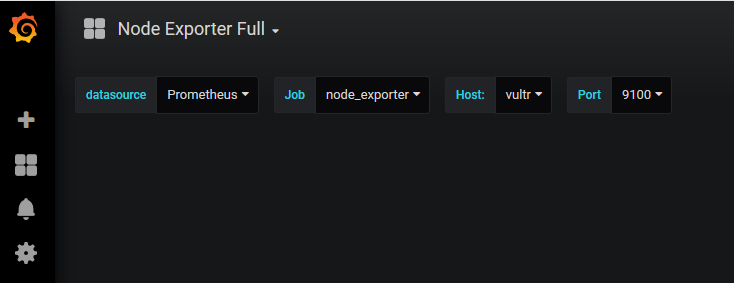
That’s it. You’ll see the node_exporter’s dashboard.
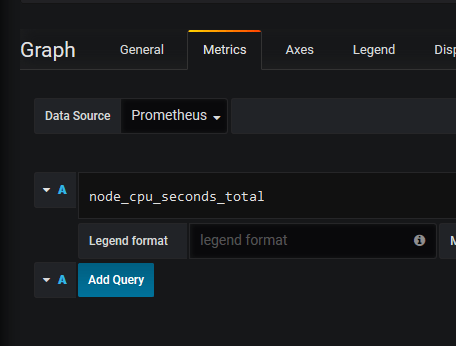
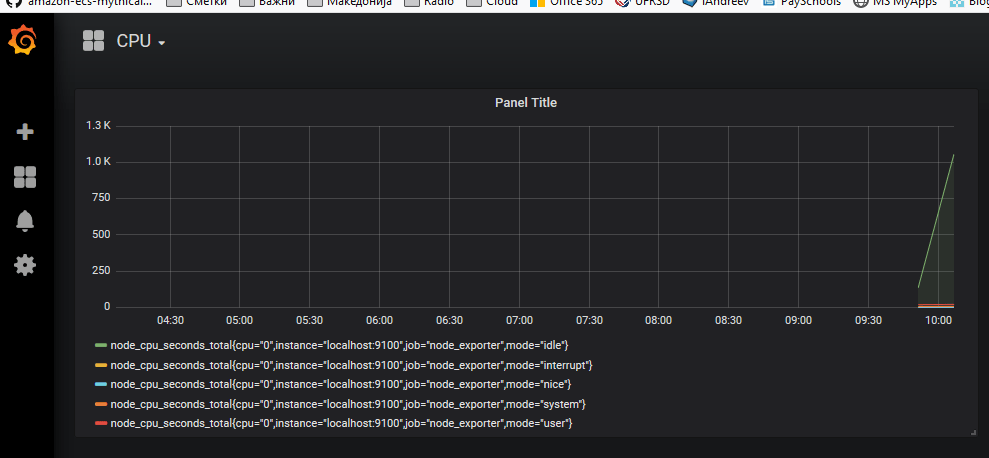
Now, you can add dashboards. Click on the (+) on the left, click on Dashboard, click on the arrow next to Panel Title and select Edit. Add some metrics such as this example below and click on Add Query.
Finally click on the floppy icon on top to save the dashboard. It looks like this after.
You can also go to this site and use some community dashboards for various metrics and applications.
3 comments
First of all, the amazing choice of background images, thank you for that too!
I’ve followed your howto but my dashbord is empty, just a big black blank page…what am I missing?
You have to add dashboards. I’ve added some extra content at the end on how to create dashboards. Not sure why node_exporter is now showing.
UPDATE: Remove grafana5, install grafana6 and download Node Exporter for FreeBSD.
https://grafana.com/grafana/dashboards/4260
Hello! I’m trying to install this into a TrueNAS Jail, and it seems to work okay but when I try and start prometheus it doesn’t seem to want to start. I’m running Grafana 8.0.5, if that matters.