Recently, we were migrating some Node.js applications to a different AWS account and we had a need to monitor the application with Prometheus and Grafana. In this post, I’ll explain how to install both Prometheus and Grafana using Helm charts, then we’ll create a simple Express.js web app, create a Helm chart for it and deploy it on an EKS cluster in AWS. I am using an EKS cluster, but you can use any Kubernetes cluster that you can manage it with kubectl. You might have to make some changes though in how you access the Load Balancer for Grafana.
Requirements:
-
– eksctl
– kubectl
– helm
Table of Contents
Create EKS cluster
This is optional, if you already have a running Kubernetes cluster, you can skip this step.
eksctl create cluster --name eksTest \
--region us-east-2 \
--instance-types t3.medium \
--nodes 2 \
--managed \
--version 1.22
This command will create a 2 node cluster, with t3.medium instances in Ohio region using Amazon Linux 2 image. It will take about 15 minutes.
Verify that everything looks OK.
kubectl get nodes
NAME                                           STATUS   ROLES    AGE     VERSION
ip-192-168-10-4.us-east-2.compute.internal     Ready    <none>   8m54s   v1.22.15-eks-fb459a0
ip-192-168-74-160.us-east-2.compute.internal   Ready    <none>   8m51s   v1.22.15-eks-fb459a0
Install Prometheus and Grafana
Add the Helm repos for Prometheus, Grafana and update any changes.
helm repo add prometheus-community https://prometheus-community.github.io/helm-charts
helm repo add grafana https://grafana.github.io/helm-charts
helm repo update
We’ll create a separate namespace for Prometheus and install the chart there.
kubectl create namespace prometheus
helm install prometheus prometheus-community/prometheus \
    --namespace prometheus \
    --set alertmanager.persistentVolume.storageClass="gp2" \
    --set server.persistentVolume.storageClass="gp2"
Create this file. It tells Grafana what to use as a source (url). It’s the Prometheus endpoint service that we just installed.
cat << EOF > grafana.yaml
datasources:
  datasources.yaml:
    apiVersion: 1
    datasources:
    - name: Prometheus
      type: prometheus
      url: http://prometheus-server.prometheus.svc.cluster.local
      access: proxy
      isDefault: true
EOF
Now, let’s create a namespace for Grafana and then install Grafana in that namespace. Change the admin password. In my case it’s Password1$.
kubectl create namespace grafana
helm install grafana grafana/grafana \
    --namespace grafana \
    --set persistence.storageClassName="gp2" \
    --set persistence.enabled=true \
    --set adminPassword='Password1$' \
    --values grafana.yaml \
    --set service.type=LoadBalancer
You’ll get something like this on the screen when the install ends.
export SERVICE_IP=$(kubectl get svc --namespace grafana grafana -o jsonpath='{.status.loadBalancer.ingress[0].ip}')
That’s your load balancer IP so you can access Grafana. If you use EKS, your IP is different.
kubectl get services -n grafana
NAME      TYPE           CLUSTER-IP     EXTERNAL-IP                                                               PORT(S)        AGE
grafana   LoadBalancer   10.100.20.53   a074996f790b74793a74bec584c04460-2034633908.us-east-2.elb.amazonaws.com   80:31916/TCP   3m21s
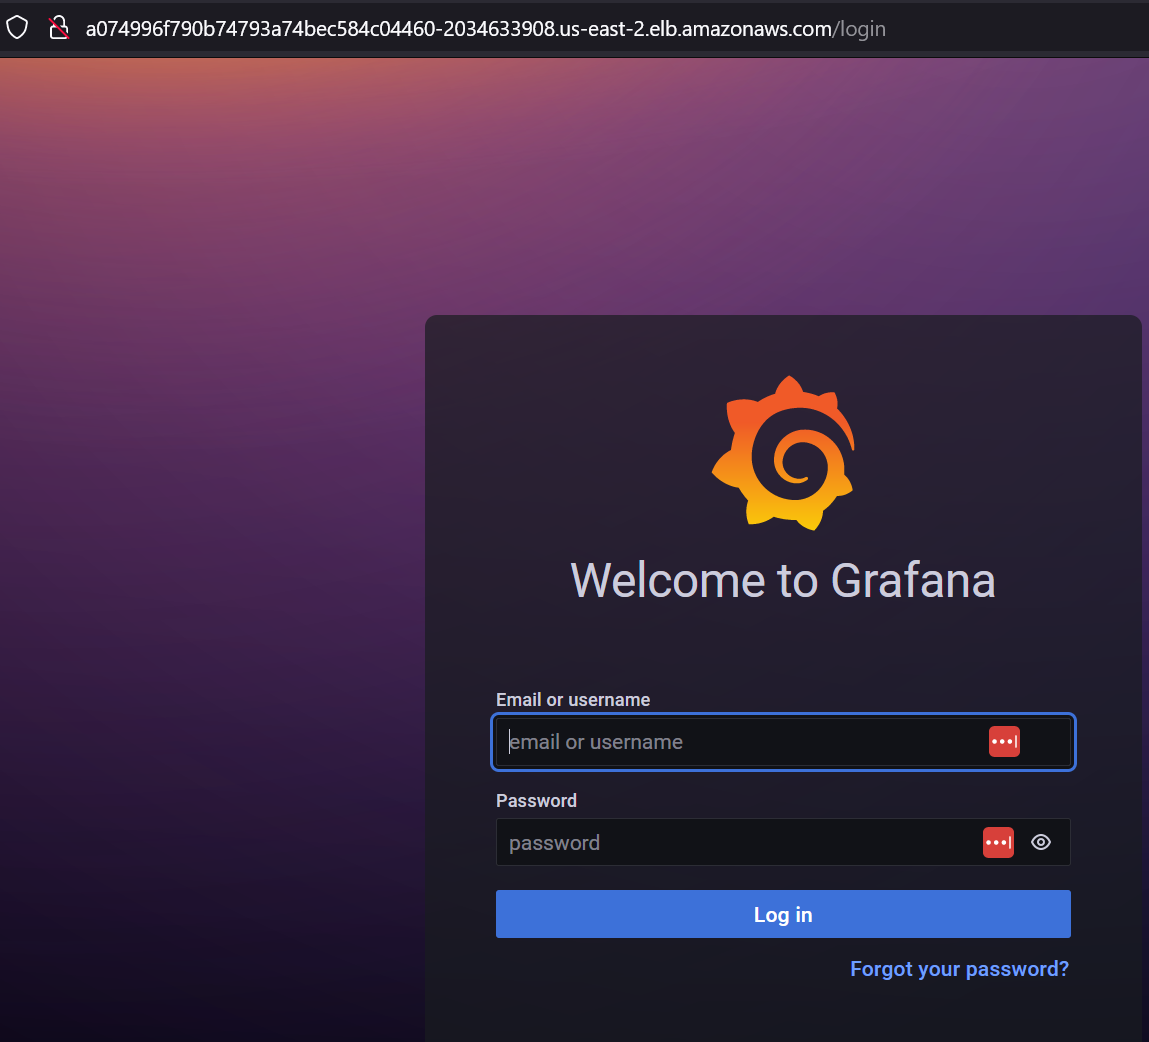
The IP is the gibberish URL that ends with amazonaws.com. If you go to that URL, you can log as admin and your password.
Go to Dashboards, click on the New button on the right and click Import.
Add the following dashboard IDs (one by one then click Load) and choose Prometheus as a source. The IDs are 3119 (Kubernetes cluster), 6417 (pods) and 11159 (Node.js). For the first dashboard, you’ll have some metrics. The Node.js dashboard is empty and our goal is to get the metrics from the application.
Node.js application
Create an empty folder and add this file.
mkdir mynodeapp
cd mynodeapp
cat << EOF > package.json
{
  "name": "mynodeapp",
  "version": "1.0.0",
  "description": "Node.js on Docker",
  "author": "Kliment Andreev <[email protected]>",
  "main": "server.js",
  "scripts": {
    "start": "node server.js"
  },
  "dependencies": {
    "express": "^4.16.1",
    "prom-client": "^14.1.1"
  }
}
EOF
I use Node v18.12. Install the dependencies.
npm install
This is the simple web application. It listens on port 3000.
cat << "EOF" > server.js
'use strict'
const express = require('express')
const prom = require('prom-client')

const collectDefaultMetrics = prom.collectDefaultMetrics();

const app = express()
const port = process.env.PORT || 3000

app.get('/', (req, res, next) => {
  res.send('Hello World!');
});

app.get('/metrics', async (req, res) => {
  try {
	  res.set('Content-Type', prom.register.contentType);
	  res.end(await prom.register.metrics());
  }
  catch (ex) {
	  res.status(500).end(ex);
  }
});

const server = app.listen(port, () => {
  console.log(`mynodeapp listening on port ${port}!`)
})
EOF
The app is a super simple web app that prints Hello World! The important part is the /metrics router. That’s how you get the metrics from the app. When we created the package.json file, we specify the prom-client as dependency. That’s the part that collects the metrics. Go to this link for more info.
Start the app with node server.js.
node server.js
mynodeapp listening on port 3000!
Go to the localhost or the server IP where this app is running and you’ll see Hello World! printed out.

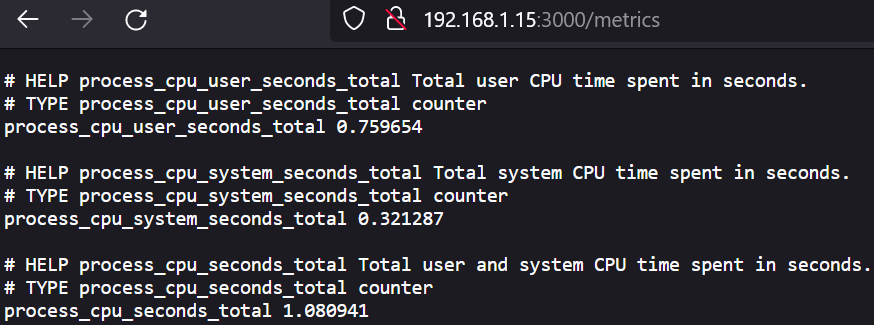
And if you go to the /metrics URL, you’ll see this text. That’s what Prometheus expects.
Now that we know the app is working, let’s create a Docker image.
Docker image and container
Create this Dockerfile.
cat << EOF > Dockerfile
FROM node:18-alpine

# Create app directory
WORKDIR /app

# Install app dependencies
# A wildcard is used to ensure both package.json AND package-lock.json are copied
# where available (npm@5+)
COPY package*.json ./

RUN npm install
# If you are building your code for production
# RUN npm install --only=production

# Bundle app source
COPY server.js /app

EXPOSE 3000
CMD [ "npm", "start", "server.js" ]
EOF
Create a Docker image based on the Dockerfile above. Replace the username with your Docker Hub username.
docker build -t <username>/mynodeapp:latest .
Run the container from the image.
docker run -p 3000:3000 <username>/mynodeapp:latest

> [email protected] start
> node server.js server.js

mynodeapp listening on port 3000!
Use the same test as before by going to the localhost or IP URL on port 3000.
If everything is OK, publish the image on Dockerhub.
docker login
docker push <username>/mynodeapp
Helm chart
Now that we have the Docker image, we’ll create a Helm chart so we can deploy the web app to the Kubernetes cluster.
Create the necessary structure.
helm create mynodeapp
Creating mynodeapp
Go to the sub-directory mynodeapp and edit the values.yaml file first. Look for the image key first and replace it so it looks like this. Make sure you replace the
image:
  repository: <username>/mynodeapp
  pullPolicy: IfNotPresent
  # Overrides the image tag whose default is the chart appVersion.
  tag: "latest"
Then look for podAnnotations: {} line and replace it so it looks like this.
podAnnotations:
  prometheus.io/scrape: "true"
  prometheus.io/path: "/metrics"
  prometheus.io/port: "3000"
Look for the service parameter and change it so it looks like this.
service:
  type: LoadBalancer
  port: 80
  targetPort: 3000
  name: mynodeapp-service
Look for the resources key and uncomment the defaults.
resources: {}
  # We usually recommend not to specify default resources and to leave this as a conscious
  # choice for the user. This also increases chances charts run on environments with little
  # resources, such as Minikube. If you do want to specify resources, uncomment the following
  # lines, adjust them as necessary, and remove the curly braces after 'resources:'.
limits:
  cpu: 100m
  memory: 128Mi
requests:
  cpu: 100m
  memory: 128Mi
Edit the templates/deployment.yaml file and find these lines.
ports:
  - name: http
    containerPort: {{ .Values.service.port }}
Replace the containerPort to look like this.
containerPort: 3000
Go back to the root of the mynodeapp folder and check the chart.
helm install mynodeapp --generate-name
NAME: mynodeapp-1674575241
LAST DEPLOYED: Tue Jan 24 10:47:22 2023
NAMESPACE: default
STATUS: deployed
REVISION: 1
NOTES:
1. Get the application URL by running these commands:
     NOTE: It may take a few minutes for the LoadBalancer IP to be available.
           You can watch the status of by running 'kubectl get --namespace default svc -w mynodeapp-1674575241'
  export SERVICE_IP=$(kubectl get svc --namespace default mynodeapp-1674575241 --template "{{ range (index .status.loadBalancer.ingress 0) }}{{.}}{{ end }}")
  echo http://$SERVICE_IP:80
Execute the export SERVICE_IP command above and echo the IP. That’s your URL. If you go to that URL you’ll see the Hello World! greetings.
What we care is the pod. Get the pod running. It’s in the default namespace.
kubectl get pods
NAME                                    READY   STATUS    RESTARTS   AGE
mynodeapp-1674575241-5ff9d7469d-pddcz   1/1     Running   0          3m
Get the annotations. Replace with your pod name.
kubectl get pod mynodeapp-1674575241-5ff9d7469d-pddcz -o jsonpath='{.metadata.annotations}'
{"kubernetes.io/psp":"eks.privileged","prometheus.io/path":"/metrics","prometheus.io/port":"3000","prometheus.io/scrape":"true"}
You can see the prometheus annotations.
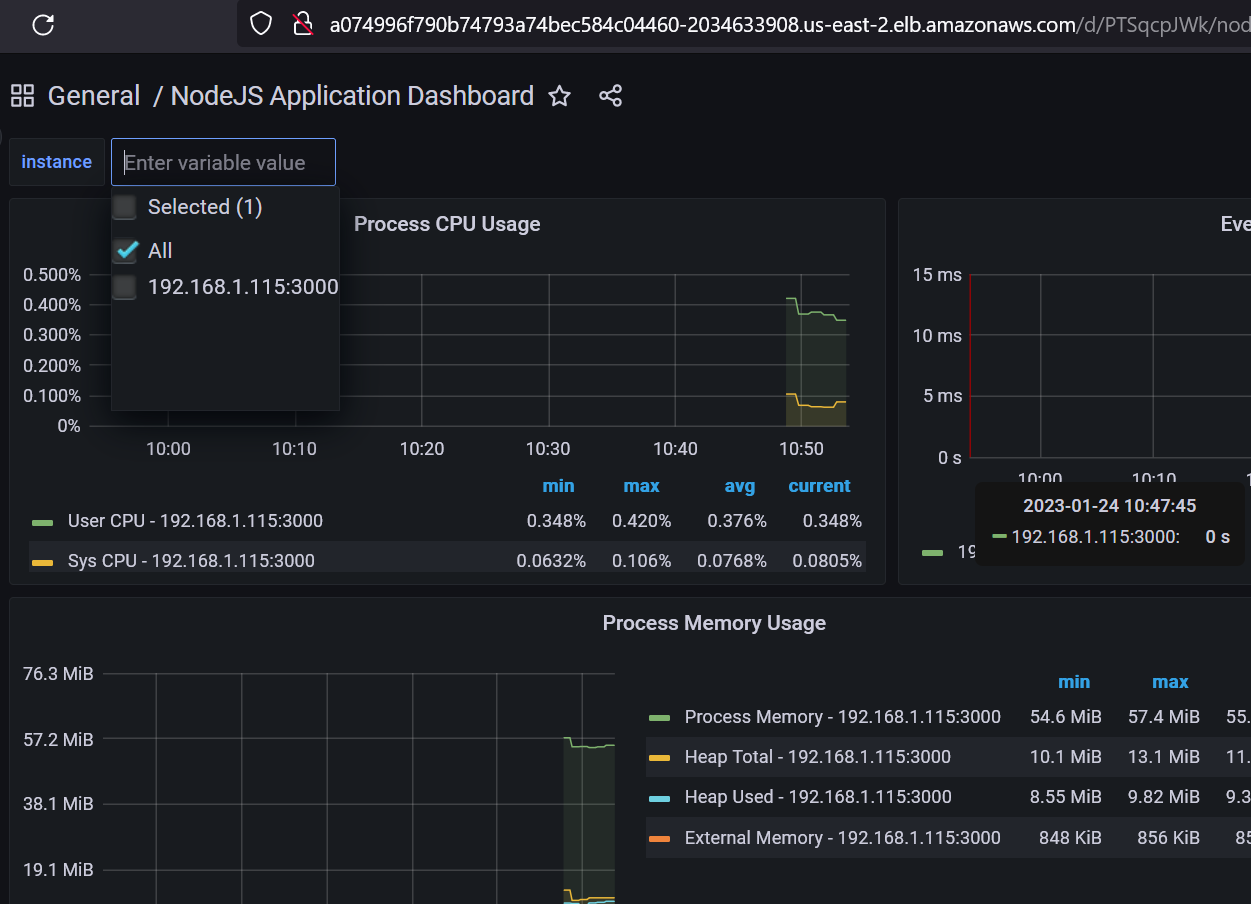
And if you go to Grafana and open up the NodeJS dash you’ll see the metrics.