
In this post I’ll explain several things related to EKS monitoring and logging.
-
– How to create an EKS cluster
– Enable the EKS control plane logs and send them to CloudWatch
– Send these logs from CloudWatch to OpenSearch cluster
– Install Container Insights and FluentBit and send logs to CloudWatch
– Install Prometheus and Grafana to monitor and visualize EKS cluster metrics
– WordPress and CloudWatch log group
In order to do that, we’ll need the following CLI tools.
-
– eksctl
– kubectl
– helm
– aws cli
You can easily find how to install and configure these tools for various OSes.
Table of Contents
Create the EKS cluster
I’ll create a managed cluster called eksWordPress in us-east-2 region with two t3.medium nodes.
eksctl create cluster --name eksWordPress --region us-east-2 --instance-types t3.medium --nodes 2 --managed --version 1.22
If you get an error that the last supported version is 1.21, update eksctl tool. The cluster creation took about 20 mins for me.
Send EKS logs to CloudWatch
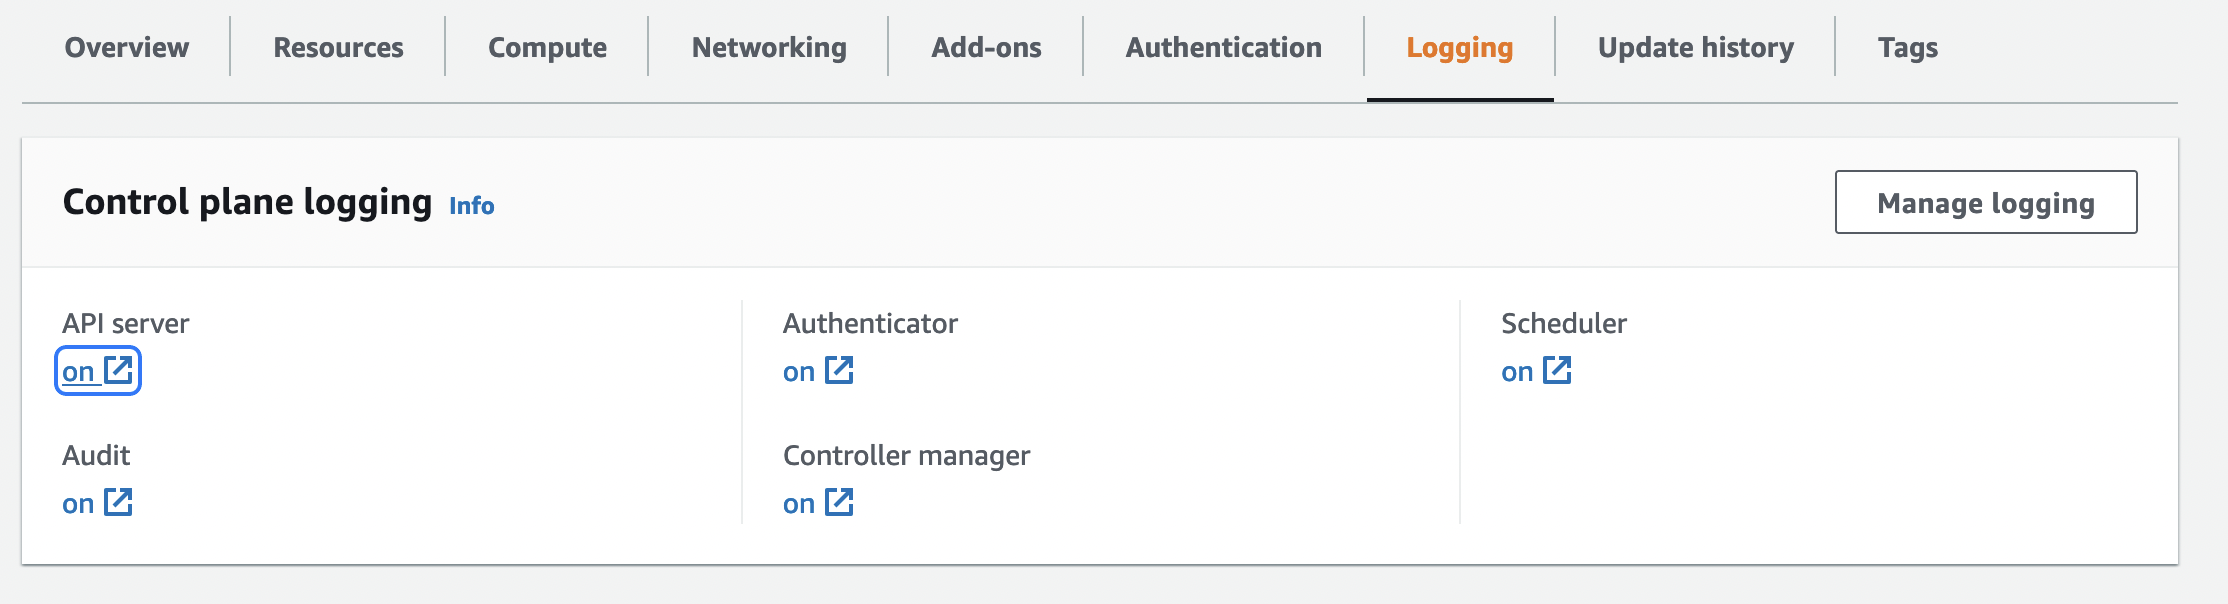
Once the cluster was created and up and running, enabling the EKS control plane logs is easy. There are 5 log types (API server, Audit, Authenticator, Controller Manager and Scheduler logs). The logged info is a lot, so it’s up to you what you want to log. There is no way to choose what to log, e.g. info, warning, errors. Everything is logged. To enable logging from the console, go to the EKS cluster, select it, click the Logging tab and then click on the Manage logging button.
If you want to do it from a CLI, type this command and specify what types of logs you want sent to CloudWatch. Specify the region and the cluster name.
aws eks update-cluster-config \
    --region <REGION> \
    --name <CLUSTER_NAME> \
    --logging '{"clusterLogging":[{"types":["api","audit","authenticator","controllerManager","scheduler"],"enabled":true}]}'
In addition, because we provisioned the cluster with the eksctl tool, we can also enable the logs using eksctl.
eksctl utils update-cluster-logging --enable-types all --cluster <CLUSTER_NAME> --approve
Or for certain types, use…
eksctl utils update-cluster-logging --enable-types <LOG_TYPE> --cluster <CLUSTER_NAME> --approve
You can use the same types as in the AWS CLI command above (api, audit, scheduler…).
If you go to CloudWatch and then the Log groups, you’ll see the log group with the name of the EKS cluster (/aws/eks/eksWordPress/cluster).
Make sure you change the retention from Never to some value. You probably don’t want to keep these logs indefinitely. If you look at the logs streams, you’ll see that there is a lot of info there. Most of the stuff is useless.
Send the logs to OpenSearch cluster
Let’s create a public OpenSearch cluster with anonymous access that only you can access. Replace the IP at the end of the statement with your IP address. It takes less than 10 mins for the OpenSearch cluster to be provisioned.
aws opensearch create-domain --domain-name oswordpress --engine-version OpenSearch_1.3 \
    --auto-tune-options DesiredState="ENABLED" --cluster-config InstanceType=t3.small.search,InstanceCount=2 \
    --ebs-options EBSEnabled=true,VolumeType=gp3,VolumeSize=10,Iops=3000 \
    --access-policies '{"Version": "2012-10-17", "Statement": [{"Action": "es:*", "Principal":"*","Effect": "Allow", "Condition": {"IpAddress":{"aws:SourceIp":["2.18.2.19/32"]}}}]}'
Once the cluster is provisioned you can get the public URL with:
echo `aws es describe-elasticsearch-domain --domain-name oswordpress --output text --query "DomainStatus.Endpoint"`\\_dashboards
You can also get the dashboard URL from the cluster settings as well.

Create the following IAM policy. Save the policy below as policy-file.json but change the account_no in line 9 to match your AWS account.
{
    "Version": "2012-10-17",
    "Statement": [
        {
            "Action": [
                "es:*"
            ],
            "Effect": "Allow",
            "Resource": "arn:aws:es:us-east-2:<account_no>:domain/oswordpress/*"
        }
    ]
}
And then create the IAM policy.
aws iam create-policy --policy-name polOpenSearch --policy-document file://policy-file.json
Create the role. Save the policy below as policy-trust.json.
{
  "Version": "2012-10-17",
  "Statement": [
    {
      "Effect": "Allow",
      "Principal": {
        "Service": "lambda.amazonaws.com"
      },
      "Action": "sts:AssumeRole"
    }
  ]
}
And then create the role.
aws iam create-role --role-name rolOpenSearch --assume-role-policy file://policy-trust.json
Finally, attach the policy to the role.
aws iam put-role-policy --role-name rolOpenSearch --policy-name polOpenSearch --policy-document file://policy-file.json
Go to CloudWatch, select the Log group, from the Actions button select Subscription filters and then Create Amazon OpenSearch service subscription filter.
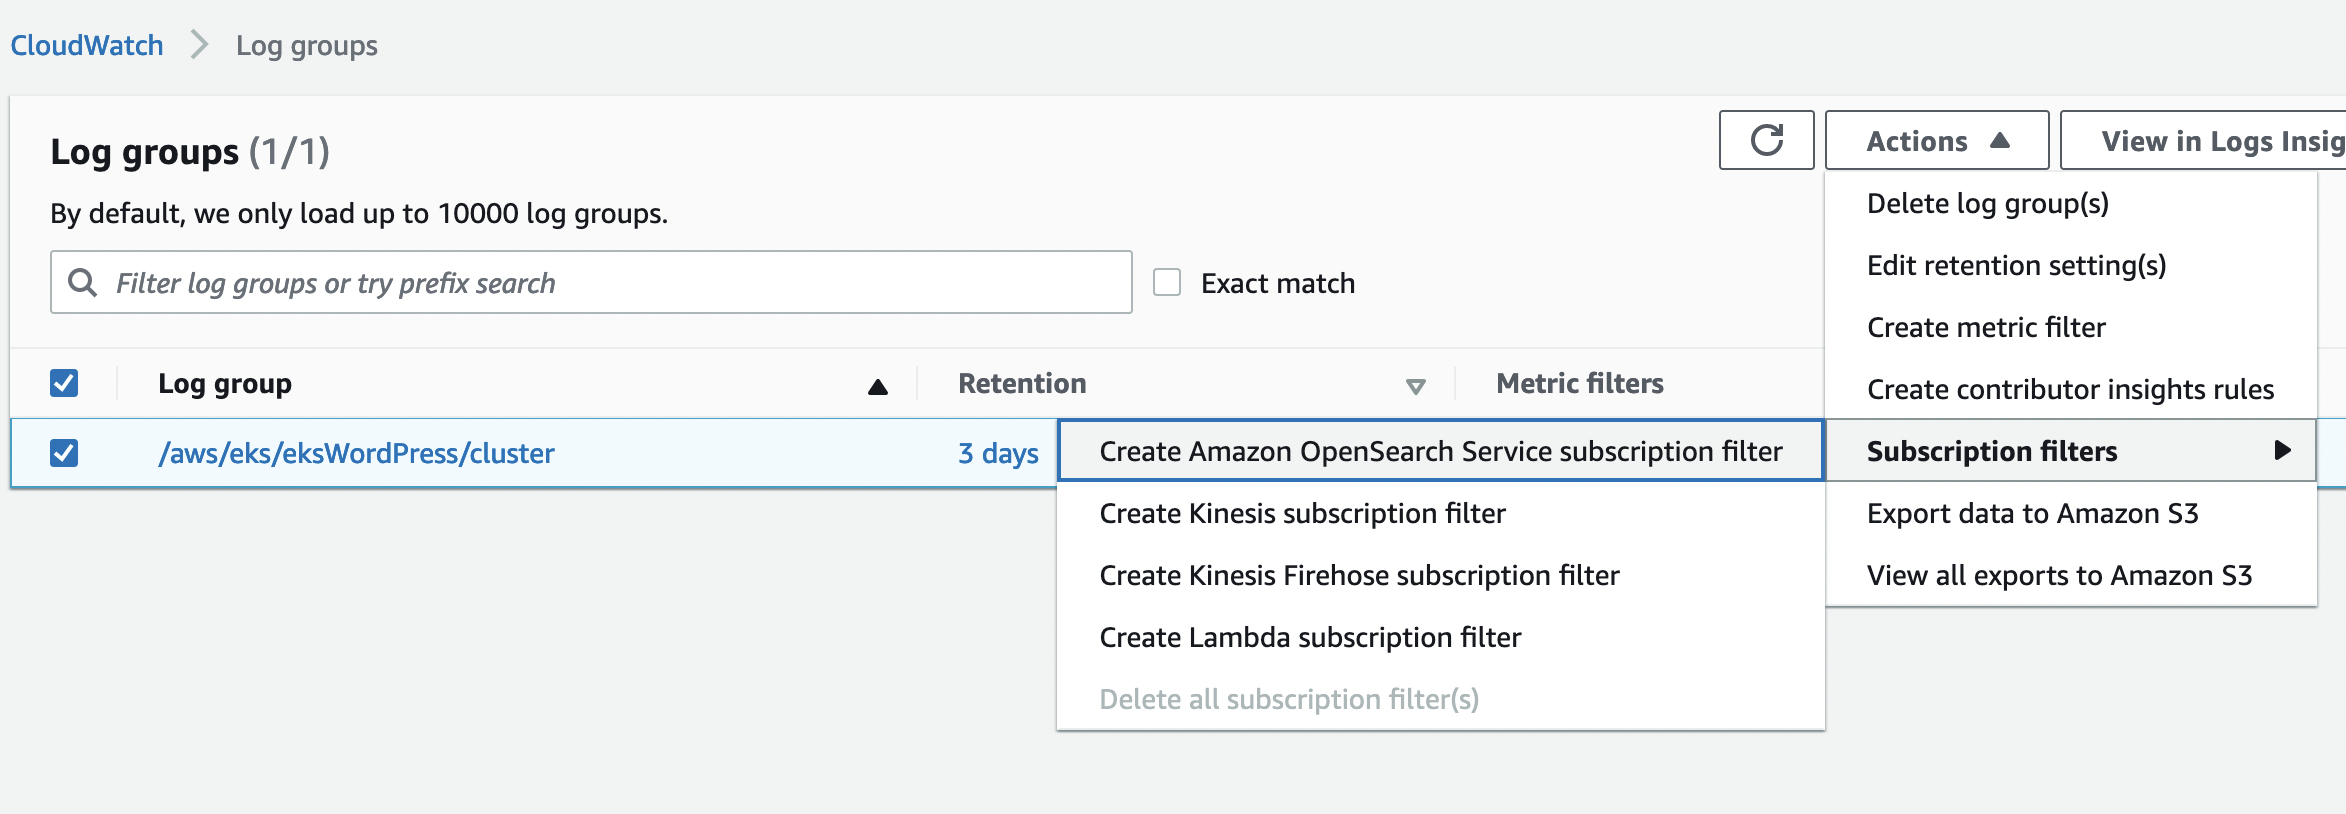
Choose the OpenSearch cluster that we created, the log format is JSON, subscription filter pattern is ” “ for all events and type all subscription filter name or whatever you want to name this pattern. Click Start streaming button.
Now, go to OpenSearch dashboard and from the hamburger menu in the upper left corner, click on Visualize. In the middle of the screen, you’ll be prompted to create an index pattern. Type cwl* and click Next step.

Select @timestamp from the drop down menu and click on Create index pattern. You’ll see the fields and the index.

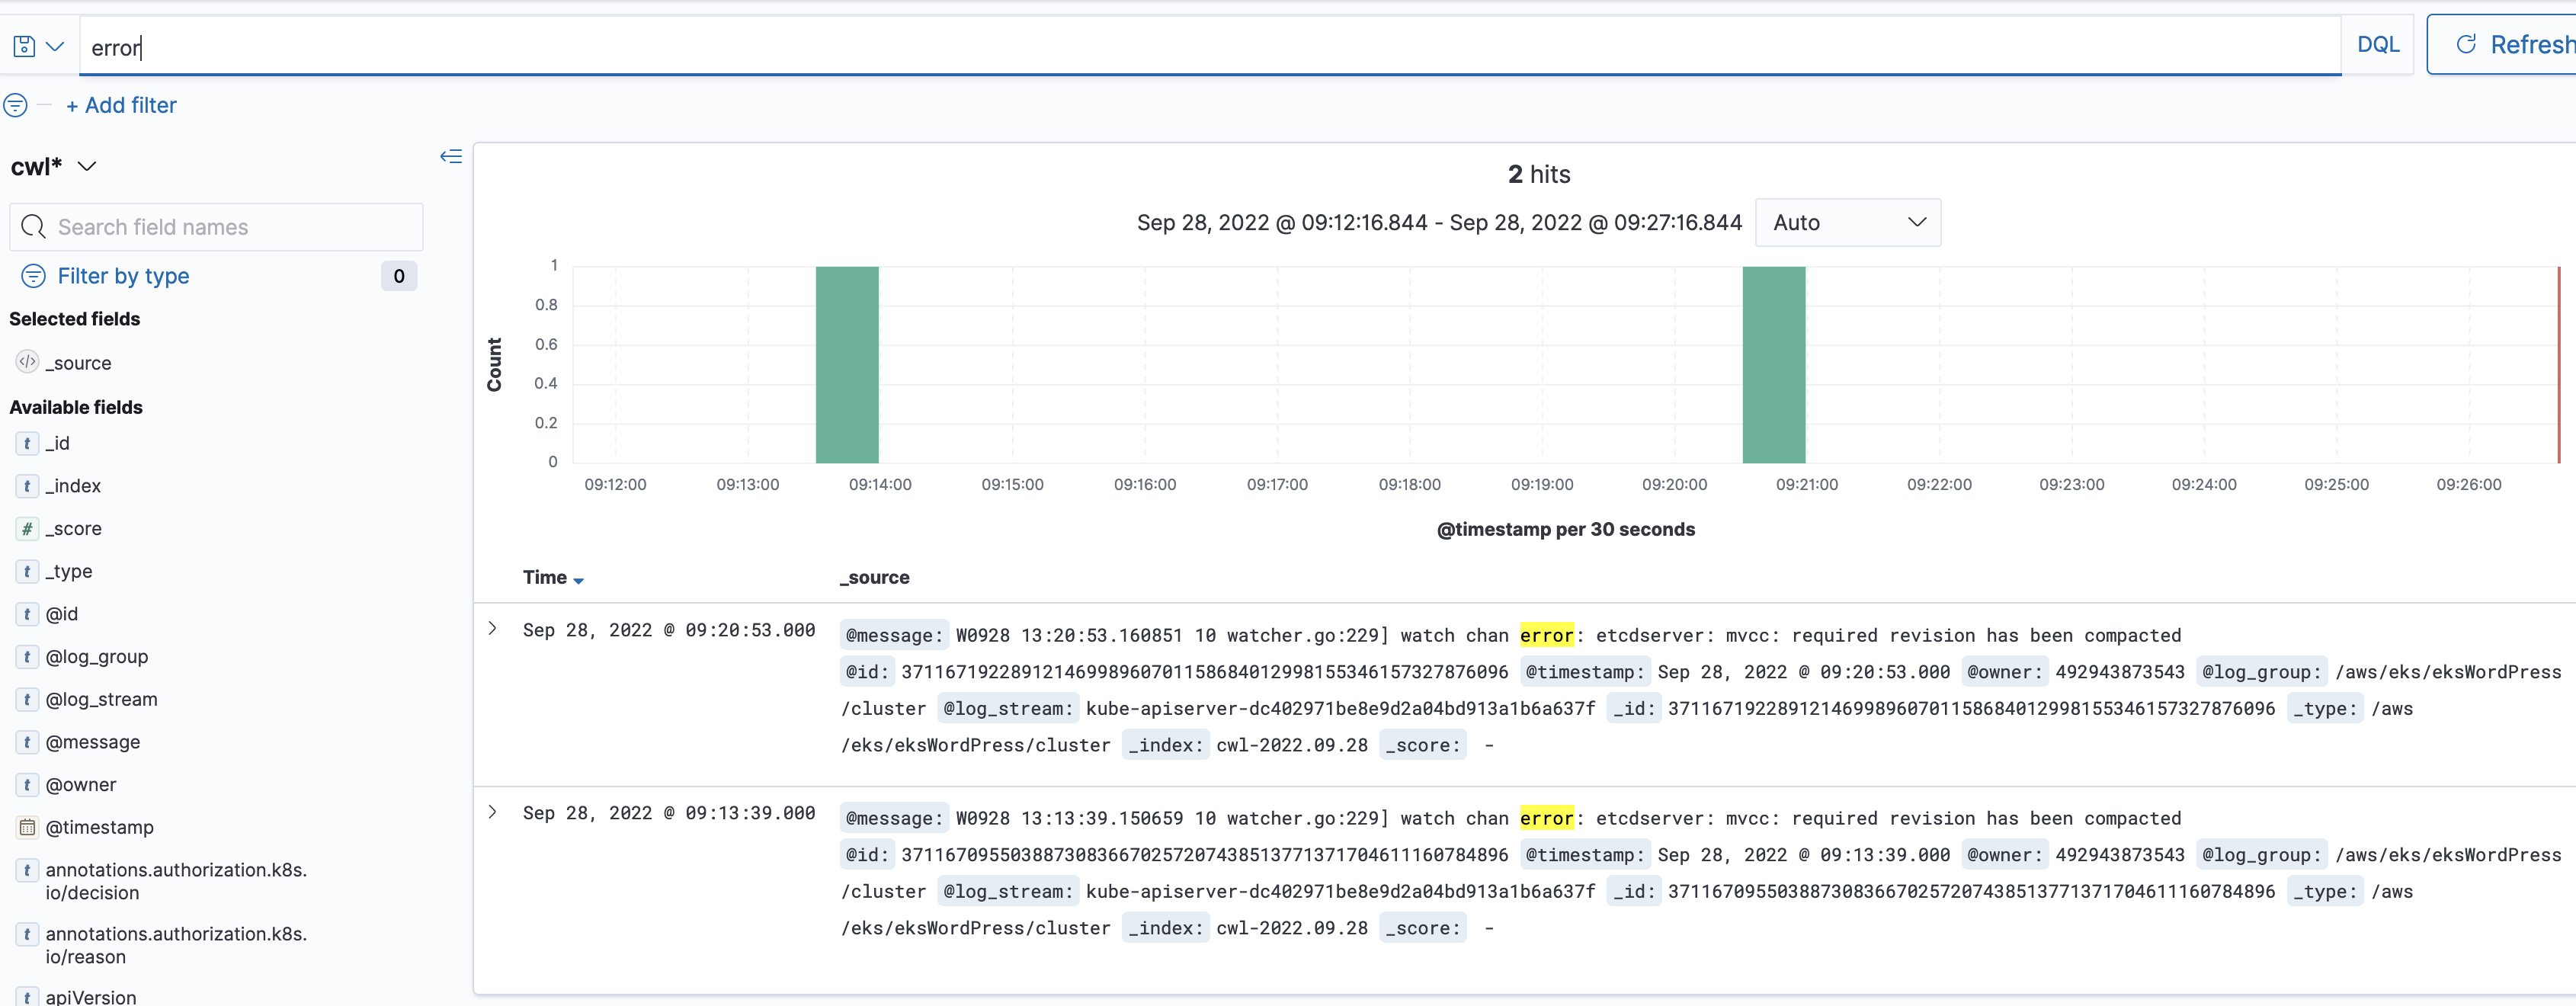
Click on the Discover from the hamburger menu and you’ll see your data there. You can use queries to search your data, but that’s out of the scope of this post.
Container Insights and FluentBit
Container Insights is a CloudWatch agent that we’ll install on the EKS cluster. It will collect all kinds of metrics and then FluentBit as a log forwarder will ship those logs to CloudWatch. See this link for more info.
Let’s do the prerequisites work first.
Get the nodes. Type the first line only, the rest is my output.
kubectl get nodes
NAME                                           STATUS   ROLES    AGE     VERSION
ip-192-168-56-250.us-east-2.compute.internal   Ready    <none>   3h39m   v1.22.12-eks-ba74326
ip-192-168-66-251.us-east-2.compute.internal   Ready    <none>   3h39m   v1.22.12-eks-ba74326
Get the instance ID from any of the instances, it doesn’t matter. Replace the name accordingly after Values=.
aws ec2 describe-instances --filters 'Name=private-dns-name,Values=ip-192-168-56-250.us-east-2.compute.internal' \
    --output text --query 'Reservations[*].Instances[*].InstanceId'
i-05adaa0a823a8549a
Once you have the instance ID of any node, get the Arn of the IAM role that’s the attached to that node.
aws ec2 describe-instances --region us-east-2 --instance-ids i-05adaa0a823a8549a --query 'Reservations[*].Instances[*].IamInstanceProfile.Id'
[
    [
        "AIPAXFRN6SYD75I5N4BUN"
    ]
]
Get the role name. Replace the ID (AIPAX…) with your value above.
aws iam list-instance-profiles --query 'InstanceProfiles[?InstanceProfileId==`AIPAXFRN6SYD75I5N4BUN`].Roles[*].RoleName'
[
    [
        "eksctl-eksWordPress-nodegroup-ng-NodeInstanceRole-LWJZESQ468Y2"
    ]
]
We want to add a policy that allows nodes to write to CloudWatch logs group. Replace the –role-name with the value that you got above.
aws iam attach-role-policy --policy-arn arn:aws:iam::aws:policy/CloudWatchAgentServerPolicy --role-name eksctl-eksWordPress-nodegroup-ng-NodeInstanceRole-LWJZESQ468Y2
oidc_id=$(aws eks describe-cluster --name eksWordPress --query "cluster.identity.oidc.issuer" --output text | cut -d '/' -f 5)
Type this line and see if there is any output. If no output, execute the command after. If yes-output, then do nothing.
aws iam list-open-id-connect-providers | grep $oidc_id
If no output, type this.
eksctl utils associate-iam-oidc-provider --cluster eksWordPress --approve
Then install CloudWatch Container Insights and FluentBit. Change the CLUSTER_NAME and REGION in lines 1 and 2.
ClusterName=<CLUSTER_NAME>
RegionName=<REGION>
FluentBitHttpPort='2020'
FluentBitReadFromHead='Off'
[[ ${FluentBitReadFromHead} = 'On' ]] && FluentBitReadFromTail='Off'|| FluentBitReadFromTail='On'
[[ -z ${FluentBitHttpPort} ]] && FluentBitHttpServer='Off' || FluentBitHttpServer='On'
curl https://raw.githubusercontent.com/aws-samples/amazon-cloudwatch-container-insights/latest/k8s-deployment-manifest-templates/deployment-mode/daemonset/container-insights-monitoring/quickstart/cwagent-fluent-bit-quickstart.yaml | sed 's/{{cluster_name}}/'${ClusterName}'/;s/{{region_name}}/'${RegionName}'/;s/{{http_server_toggle}}/"'${FluentBitHttpServer}'"/;s/{{http_server_port}}/"'${FluentBitHttpPort}'"/;s/{{read_from_head}}/"'${FluentBitReadFromHead}'"/;s/{{read_from_tail}}/"'${FluentBitReadFromTail}'"/' | kubectl apply -f -
Download a config map and edit it the file called cwagent-configmap.yaml.
curl -O https://raw.githubusercontent.com/aws-samples/amazon-cloudwatch-container-insights/latest/k8s-deployment-manifest-templates/deployment-mode/daemonset/container-insights-monitoring/cwagent/cwagent-configmap.yaml
In line 11, change the variable so it points to your cluster. In my case it looks like this.
"cluster_name": "{{eksWordPress}}",
Save the changes and apply the config.
kubectl apply -f cwagent-configmap.yaml
Then deploy it as a DaemonSet.
kubectl apply -f https://raw.githubusercontent.com/aws-samples/amazon-cloudwatch-container-insights/latest/k8s-deployment-manifest-templates/deployment-mode/daemonset/container-insights-monitoring/cwagent/cwagent-daemonset.yaml
Verify that it’s running. Type the first line only. The rest is my output.
kubectl get pods -n amazon-cloudwatch
NAME                     READY   STATUS    RESTARTS   AGE
cloudwatch-agent-dfkzv   1/1     Running   0          18m
cloudwatch-agent-nfnf7   1/1     Running   0          18m
fluent-bit-8vd2n         1/1     Running   0          18m
fluent-bit-tvtpv         1/1     Running   0          18m
Check the logs.
kubectl logs <POD_NAME> -n amazon-cloudwatch
Or in my case…
kubectl logs cloudwatch-agent-dfkzv -n amazon-cloudwatch
[2022/10/03 13:28:56] [ info] [output:cloudwatch_logs:cloudwatch_logs.2] Created log stream ip-192-168-73-121.us-east-2.compute.internal.host.messages
[2022/10/03 13:29:06] [ info] [output:cloudwatch_logs:cloudwatch_logs.0] Creating log stream ip-192-168-73-121.us-east-2.compute.internal-application.var.log.containers.cloudwatch-agent-7fvxd_amazon-cloudwatch_cloudwatch-agent-5409bed9d4733a51602e4bc0cccde5e5580eb3e9282cd5cc4c1a4f2d2e28e8ea.log in log group /aws/containerinsights/eksWordPress/application
[2022/10/03 13:29:06] [ info] [output:cloudwatch_logs:cloudwatch_logs.0] Created log stream ip-192-168-73-121.us-east-2.compute.internal-application.var.log.containers.cloudwatch-agent-7fvxd_amazon-cloudwatch_cloudwatch-agent-5409bed9d4733a51602e4bc0cccde5e5580eb3e9282cd5cc4c1a4f2d2e28e8ea.log
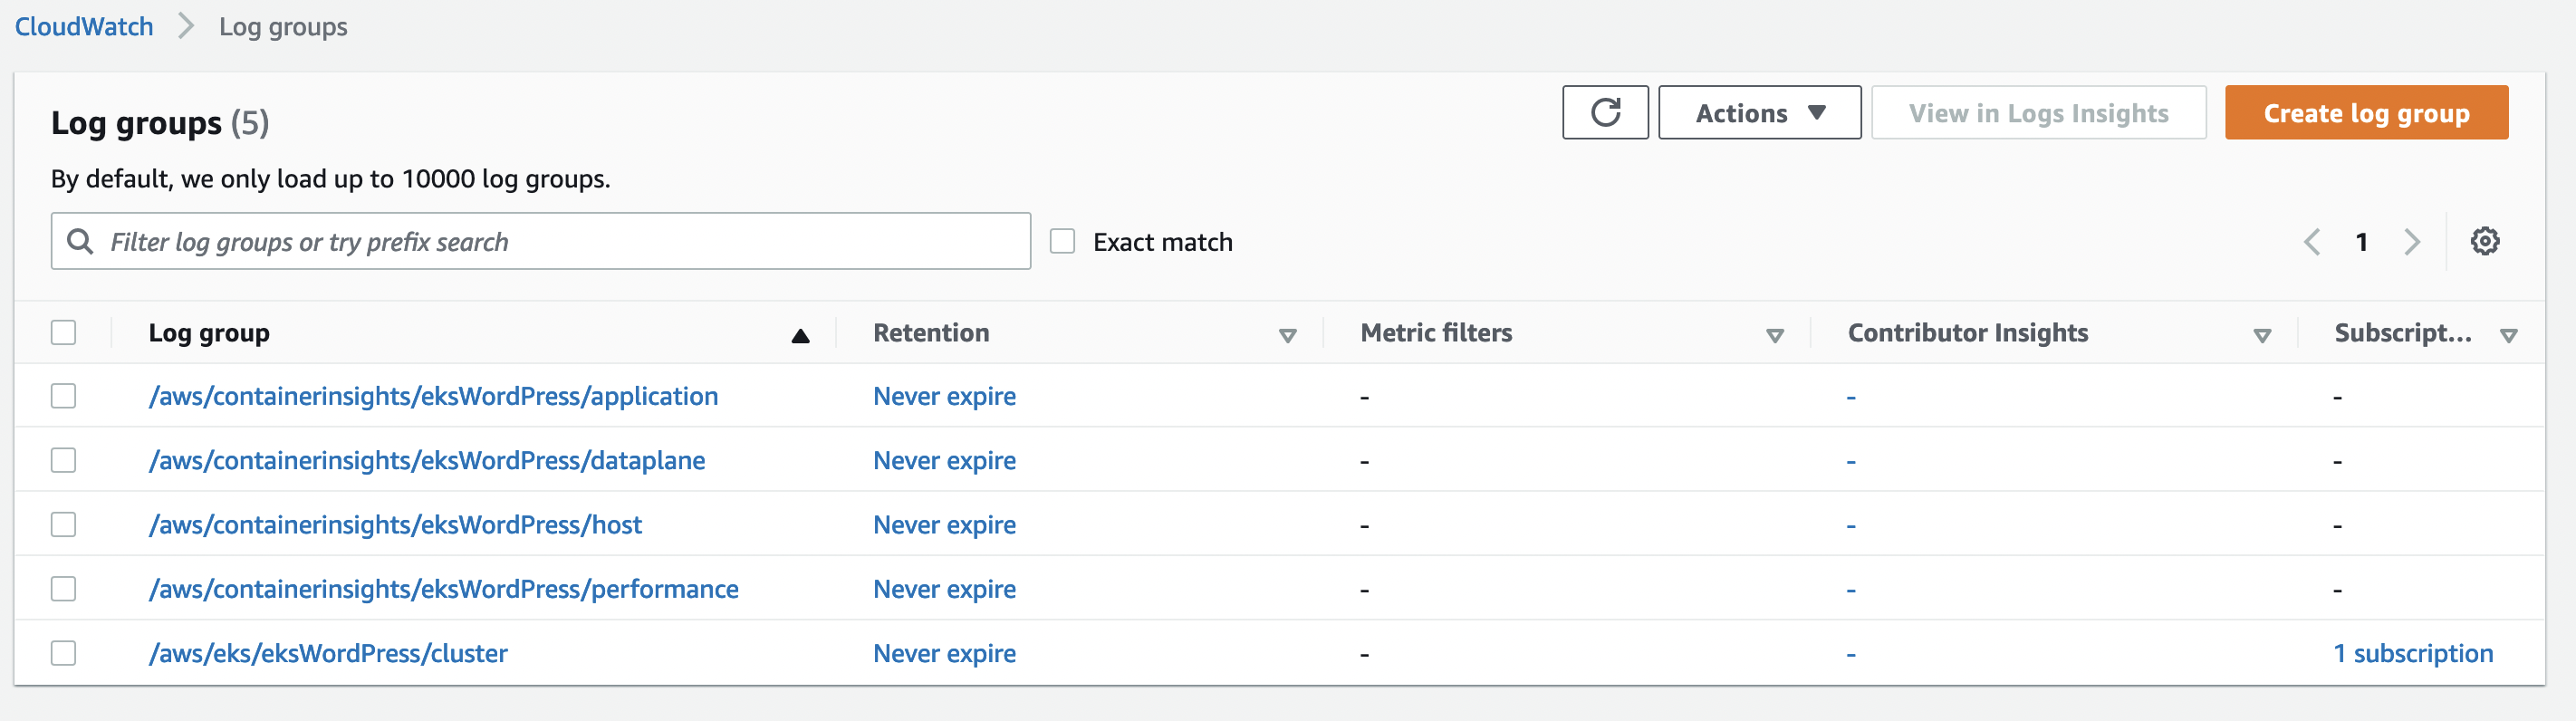
If you go to CloudWatch now you’ll see 4 new log groups.
Prometheus and Grafana
The Kubernetes API can also be monitored using Prometheus. We’ll install it using helm.
Create a namespace first.
kubectl create namespace prometheus
Add the Prometheus repo.
helm repo add prometheus-community https://prometheus-community.github.io/helm-charts
Deploy Prometheus.
helm upgrade -i prometheus prometheus-community/prometheus --namespace prometheus --set alertmanager.persistentVolume.storageClass="gp2",server.persistentVolume.storageClass="gp2"
Check if everything is OK.
kubectl get pods -n prometheus
NAME                                            READY   STATUS    RESTARTS   AGE
prometheus-alertmanager-5c57cc6945-v9lcb        2/2     Running   0          4m55s
prometheus-kube-state-metrics-77ddf69b4-jsgrp   1/1     Running   0          4m55s
prometheus-node-exporter-68dk9                  1/1     Running   0          4m55s
prometheus-node-exporter-m98xk                  1/1     Running   0          4m55s
prometheus-pushgateway-ff89cc976-4sfhl          1/1     Running   0          4m55s
prometheus-server-6c99667b9b-mpw97              2/2     Running   0          4m55s
Type this command and open up a browser and go to localhost:9090.
kubectl --namespace=prometheus port-forward deploy/prometheus-server 9090
You can CTRL-C out of the command prompt once you verify it’s OK.
Let’s add the Grafana repo first.
helm repo add grafana https://grafana.github.io/helm-charts
Copy, paste and save this as grafana.yaml.
datasources:
  datasources.yaml:
    apiVersion: 1
    datasources:
    - name: Prometheus
      type: prometheus
      url: http://prometheus-server.prometheus.svc.cluster.local
      access: proxy
      isDefault: true
Create a namespace for grafana.
kubectl create namespace grafana
Deploy using helm. Look at the adminPassword parameter. Change it to something else. In my case it’s admin123!.
helm install grafana grafana/grafana --namespace grafana --set persistence.storageClassName="gp2" --set persistence.enabled=true --set adminPassword='admin123!' --values grafana.yaml --set service.type=LoadBalancer
Check if everything is OK.
kubectl get all -n grafana
Get the URL of the classic LB that was just created.
export ELB=$(kubectl get svc -n grafana grafana -o jsonpath='{.status.loadBalancer.ingress[0].hostname}')
echo "http://$ELB"
Go to that URL and you’ll see the Grafana URL.
You should see the Grafana landing page. Log as admin and the password you specified when pods were deployed.
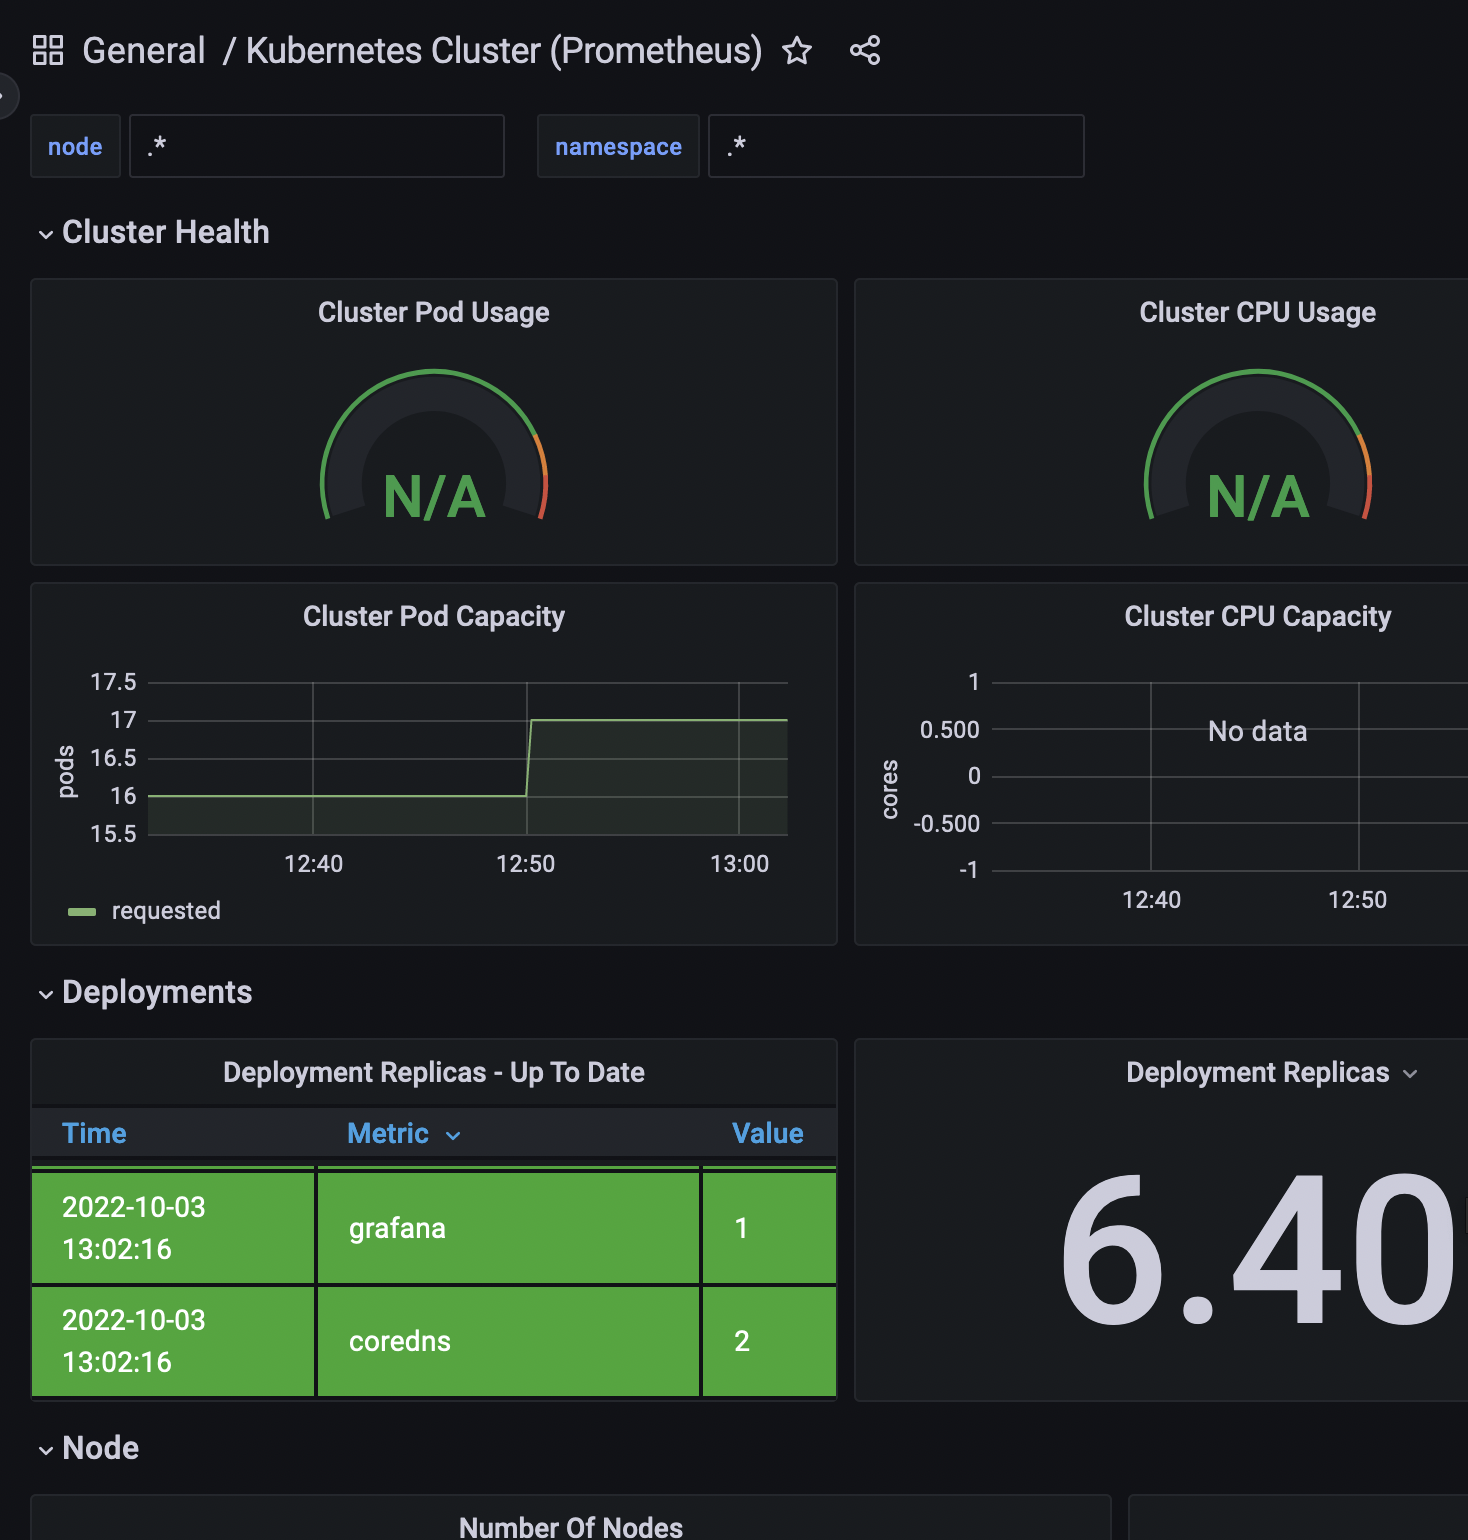
In Grafana create a new dashboard and Import the dashboard with ID 3119. Choose Prometheus as source.
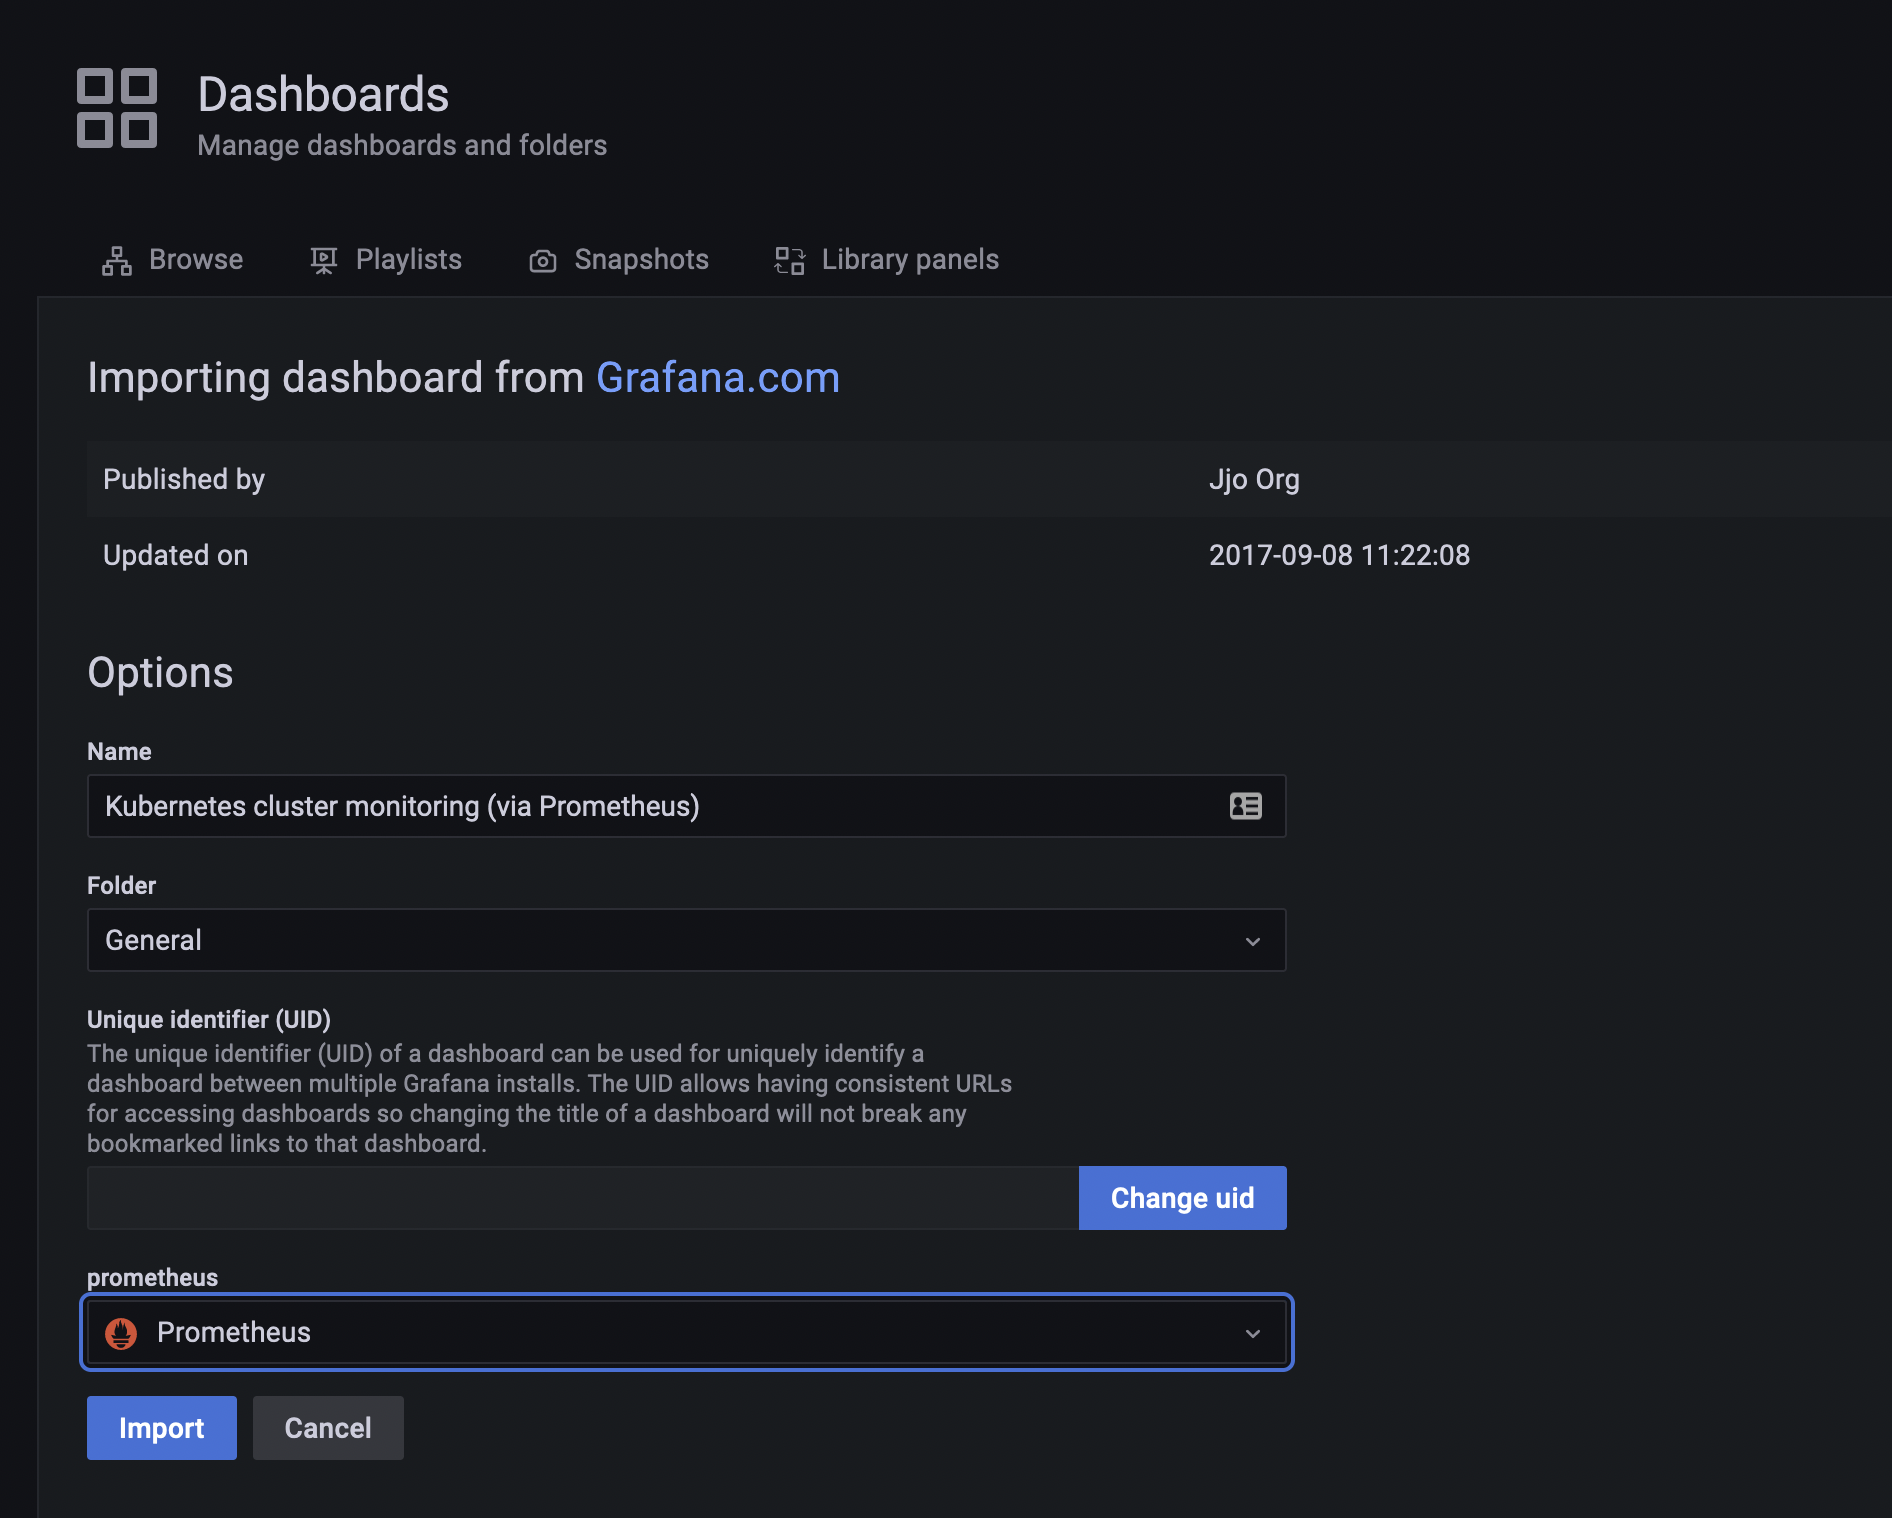
For pods monitoring use the same method but this time specify 6417 as a dashboard ID. This is how it looks like under my account.
WordPress
Let’s deploy WordPress.
kubectl create namespace wordpress
Add the Bitnami helm chart.
helm repo add bitnami https://charts.bitnami.com/bitnami
Deploy WordPress in its own namespace
helm -n wordpress install understood-zebu bitnami/wordpress
Wait for 3-4 mins and do this command. This is your ELB, get the URL, something like *zdasdfa*.elb.amazonaws.com
kubectl get svc --namespace wordpress -w understood-zebu-wordpress
The username is user and get the password with:
echo Password: $(kubectl get secret --namespace wordpress understood-zebu-wordpress -o jsonpath="{.data.wordpress-password}" | base64 -d)
If you go to the ELB URL, you’ll hit WordPress main page, if you want to login, add /wp-login.php as suffix to the above URL.
Go to CloudWatch and check the /aws/containerinsights/eksWordPress/application log group. You’ll see a bunch of references for WordPress. You can ship those to OpenSearch if you want and alert on errors or whatever you want to do.
Delete EKS and OpenSearch cluster
Detach the policy, delete the daemonset and delete the EKS cluster.
aws iam detach-role-policy --policy-arn arn:aws:iam::aws:policy/CloudWatchAgentServerPolicy --role-name eksctl-eksWordPress-nodegroup-ng-NodeInstanceRole-LWJZESQ468Y2
ClusterName=<CLUSTER_NAME>
RegionName=<REGION>
FluentBitHttpPort='2020'
FluentBitReadFromHead='Off'
[[ ${FluentBitReadFromHead} = 'On' ]] && FluentBitReadFromTail='Off'|| FluentBitReadFromTail='On'
[[ -z ${FluentBitHttpPort} ]] && FluentBitHttpServer='Off' || FluentBitHttpServer='On'
curl https://raw.githubusercontent.com/aws-samples/amazon-cloudwatch-container-insights/latest/k8s-deployment-manifest-templates/deployment-mode/daemonset/container-insights-monitoring/quickstart/cwagent-fluent-bit-quickstart.yaml | sed 's/{{cluster_name}}/'${ClusterName}'/;s/{{region_name}}/'${LogRegion}'/;s/{{http_server_toggle}}/"'${FluentBitHttpServer}'"/;s/{{http_server_port}}/"'${FluentBitHttpPort}'"/;s/{{read_from_head}}/"'${FluentBitReadFromHead}'"/;s/{{read_from_tail}}/"'${FluentBitReadFromTail}'"/' | kubectl delete -f -
eksctl delete cluster --name eksWordPress --region=us-east-2
Delete policy.
aws iam delete-policy --policy-arn arn:aws:iam::492943873543:policy/polOpenSearch
Delete CloudWatch log groups.
EKS_CLUSTER=eksWordPress
aws logs delete-log-group --log-group-name "/aws/containerinsights/$EKS_CLUSTER/application"
aws logs delete-log-group --log-group-name "/aws/containerinsights/$EKS_CLUSTER/dataplane"
aws logs delete-log-group --log-group-name "/aws/containerinsights/$EKS_CLUSTER/host"
aws logs delete-log-group --log-group-name "/aws/containerinsights/$EKS_CLUSTER/performance"
aws logs delete-log-group --log-group-name "/aws/eks/$EKS_CLUSTER/cluster"
Delete the OpenSearch cluster.
aws opensearch delete-domain --domain-name oswordpress